
This GeoPackage is made available under the CC-0 license.
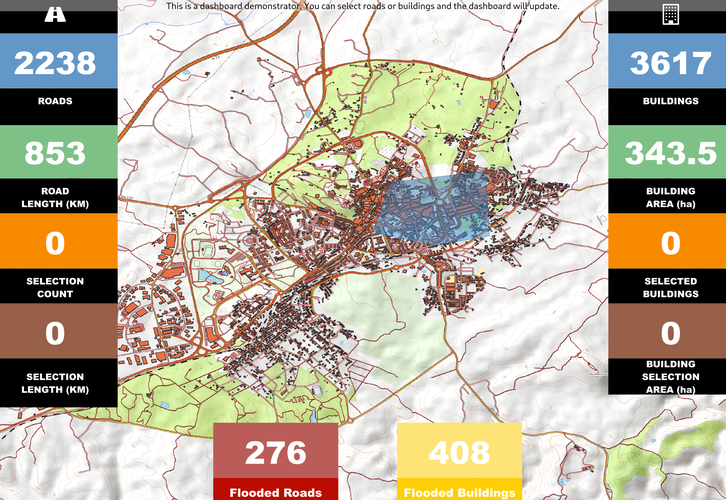
This is a demonstrator project to show how you might use labels to create a dashboard in QGIS. The project requires that you have the UN-OCHA Free Font installed. You can find the font for free here:
If you make a selection of roads or buildings, the dashboard will update automatically to show the selection count.
Likewise, adding a new flood polygon or altering the existing flood polygon will update the flooded building and roads counts.
This is a demonstrator project - it may not be practical for large datasets or indeed for anything in an of itself. It is intended to show you some techniques for working with data driven labels and aggregate expressions as well as perhaps inspiring you to do interesting things with QGIS in your own work.
You can find a detailed interactive walk through of the techniques used to make this dashboard in this video: https://youtu.be/lJTV90SvRAM
The building and roads layers is courtesy of the OpenStreetMap project. OpenStreetMap® is open data, licensed under the Open Data Commons Open Database License (ODbL) by the OpenStreetMap Foundation (OSMF). You can find out more at openstreetmap
Looks good!
Reviewed by timlinux 5 years, 3 months ago
test
Reviewed by dimas 5 years, 3 months ago
Works great
Reviewed by timlinux 5 years, 3 months ago
Thanks
Reviewed by timlinux 5 years, 3 months ago
Added layer metadata
Reviewed by timlinux 5 years, 3 months ago

This GeoPackage is made available under the CC-0 license.

Flagship membership

Flagship membership

Large membership

Large membership

Large membership

Large membership

Large membership

Large membership

Large membership

Large membership

Large membership

Large membership


