
This Map is made available under the CC-0 license.
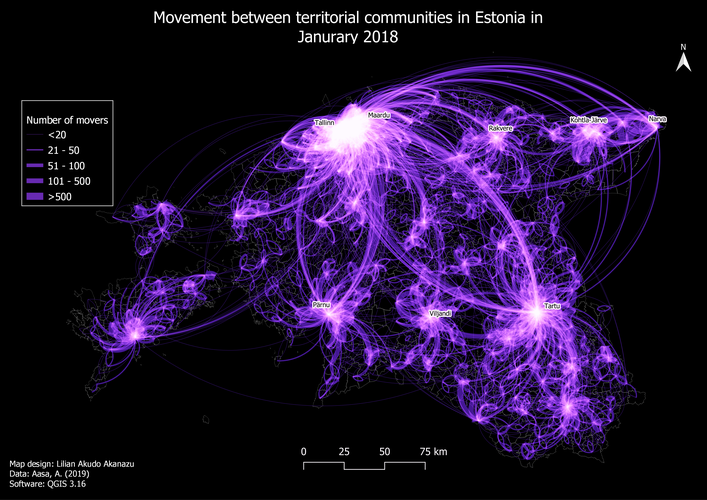
This map focuses on the movement between territorial communities in Estonia in 2018. The dataset used was imported to QGIS as an OD Matrix file and converted to lines using XY to line function in QGIS. To visually analyze the lines, the movers were converted to integers using the ‘to_int’ function on the attribute table, and the lines were categorized based on the number of movers from one point to another. Smaller movements (<5) are filtered out using attribute queries to reduce the clustering and the existing lines were further graduated based on the number of movements. The blending mode applied to the feature is the screen, to show areas of overlapping features and the geometry generator was used to change the straight lines to arcs using expressions.
Hi, Nice map, Thank you!
Reviewed by gabrieldeluca 1 year ago

This Map is made available under the CC-0 license.

Flagship membership

Flagship membership

Large membership

Large membership

Large membership

Large membership

Large membership

Large membership

Large membership

Large membership

Large membership

Large membership


