
This Map is made available under the CC-0 license.
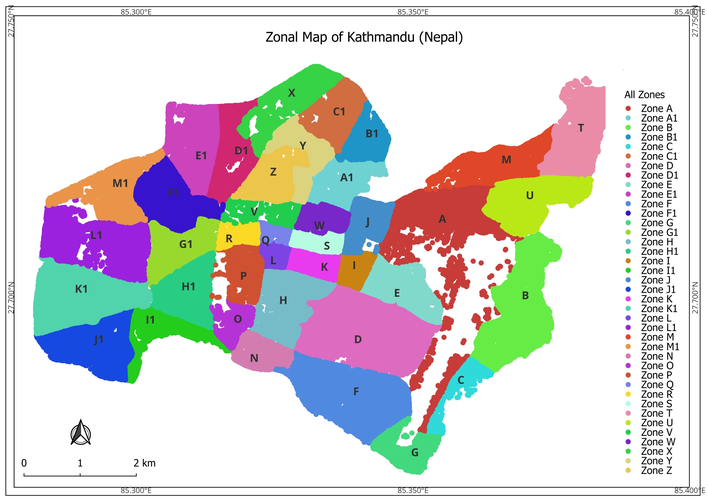
The zonal map of Kathmandu, Nepal’s capital, was created entirely using QGIS. The process involved the following steps: 1. Building Footprint Extraction – The Mapflow plugin in QGIS was used to obtain building footprints within the designated coverage area. 2. Centroid Generation – The Centroid plugin was applied to generate central points for each building. This approach was chosen to represent buildings as points rather than polygons, optimizing space and handling the large number of structures effectively. 3. Zoning via Major Roads – The generated points were grouped into zones based on major road demarcations. The zones were then dissolved to create a seamless classification of areas. 4. Zone Naming and Finalization – Each zone was assigned a distinct name, and the final output was composed using Print Composer in QGIS.
Thank you!
Reviewed by gabrieldeluca 11 months, 3 weeks ago

This Map is made available under the CC-0 license.

Flagship membership

Flagship membership

Large membership

Large membership

Large membership

Large membership

Large membership

Large membership

Large membership

Large membership

Large membership

Large membership


