
This Map is made available under the CC-0 license.
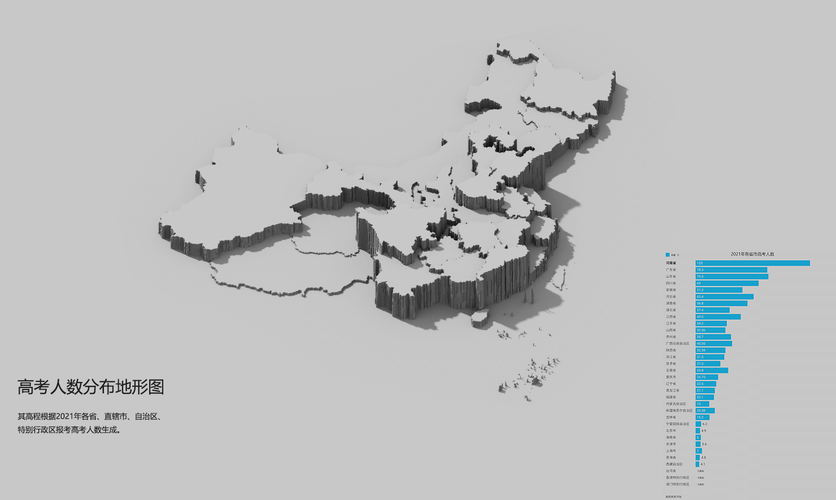
地图中用高程代表数量差异。首先使用QGIS将带有人数分布统计的矢量图层按照区域风格化——按照人数设置不同灰度值,然后导入到Aerialod渲染,最后添加统计图表。|The map uses elevation to represent differences in quantity. First, apply regional styling to the vector layer containing population distribution statistics in QGIS—assigning varying grayscale values according to population. Next, render the data in Aerialod, and conclude by incorporating statistical charts.
Thank you!
Reviewed by gabrieldeluca 11 months, 1 week ago

This Map is made available under the CC-0 license.

Flagship membership

Flagship membership

Large membership

Large membership

Large membership

Large membership

Large membership

Large membership

Large membership

Large membership

Large membership

Large membership


