
This Map is made available under the CC-0 license.
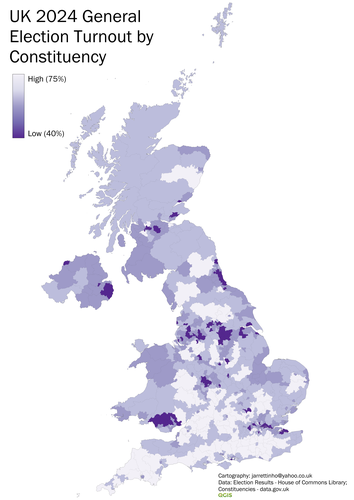
I wanted a very simple high/low turnout symbology on a constituency map of the UK. Voter turnout was a fairly normal distribution of data, so I used a 4-class standard deviation classification, rasterised the layer and used the raster colour ramp in the legend with high/low annotation to present.
Thank you!
Reviewed by gabrieldeluca 10 months, 3 weeks ago

This Map is made available under the CC-0 license.

Flagship membership

Flagship membership

Large membership

Large membership

Large membership

Large membership

Large membership

Large membership

Large membership

Large membership

Large membership

Large membership


