
This Map is made available under the CC-0 license.
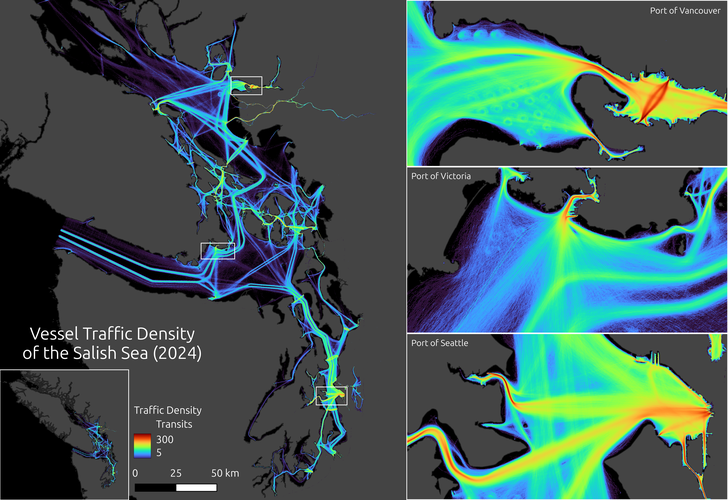
Vessels at sea are constantly reporting their positions, and these broadcasts are captured by coastal receiving stations. The raw historical data for 2024 were sourced from Marine Cadastre and processed in Python to build transit lines of vessel journeys. These transit lines were then joined onto a 10m resolution polygon grid to produce counts of the number of transits passing through each grid cell. These counts represent the total traffic density of all vessels.
That is beautiful, thank you for sharing this!
Reviewed by timlinux 1 year ago
Lgtm , thanks
Reviewed by timlinux 1 year ago

This Map is made available under the CC-0 license.

Flagship membership

Flagship membership

Large membership

Large membership

Large membership

Large membership

Large membership

Large membership

Large membership

Large membership

Large membership

Large membership


