
This Model is made available under the CC-0 license.
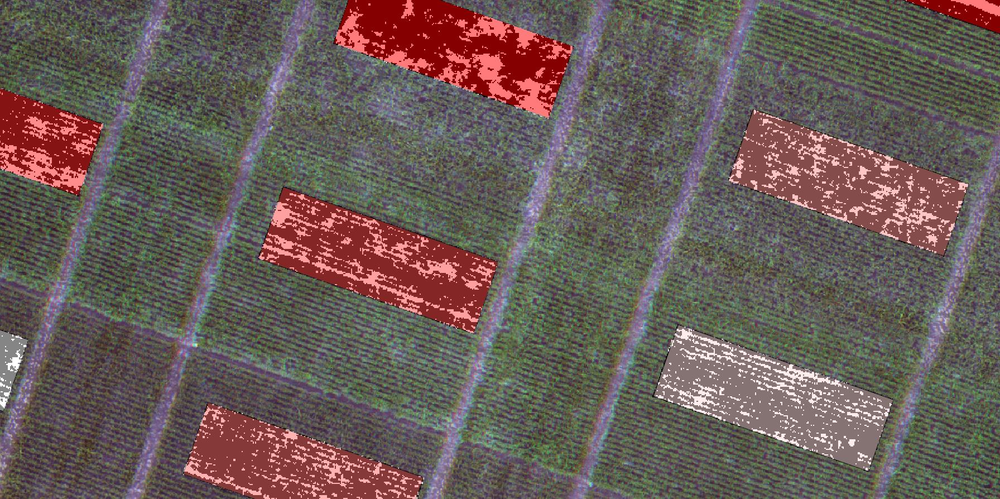
Compute zero-mean values for polygon regions of interest (ROI) and count pixels below a threshold (default threshold: mean, can be adjusted by an offset). This model was developed for agricultural field trials (ROI were plots) but can be used in other contexts, too.
The algorithm computes the mean within each ROI, substracts it from the absolute values and additionally thresholds values above (was: below) at mean + thresho ld_offset.
Useful to compare relative differences within ROIs, e.g. height differences of plant canopy within each field trial plot (derived from digital surface model DSM), independent of absolute height differences between plots (due to digial elevation DEM).
Inputs:
Outputs:
.meandiff.tif with substracted means (zero mean per plot).meandiff_thresh.tif with additionally thresholded layer.threshstat.gpkg with statisticsAttention: this model converts the inputs to a common metric CRS (UTM, EPSG:25832), this is parametrised as default and needs to be changed, if you want to use a different one. Pixel sizes are set to 0.02 units (2cm in a metric system).
Development via repository qgis-agriculture, contains example data.
Thanks for sharing this!
Reviewed by timlinux 3 years, 7 months ago
Hi, thank you for your work. The model runs without errors if the ROI layer is on the same system as the project and the targetCRS parameter is left blank, or if the tragetCRS parameter is passed the same CRS as the project. Any other targetCRS causes the model to fail to run and is not what the description indicates (it is understood that the targetCRS is optional or can be changed arbitrarily). Also, for some reason unknown to me, the raster calculator does not take the CRS of the reference layers, which causes the roi-zeromean_meandiff output to come out without a CRS.
Reviewed by gabrieldeluca 1 year, 3 months ago
Thank you very much. And thanks for including the repository and sample data.
Reviewed by gabrieldeluca 1 year, 2 months ago

This Model is made available under the CC-0 license.

Flagship membership

Flagship membership

Large membership

Large membership

Large membership

Large membership

Large membership

Large membership

Large membership

Large membership

Large membership

Large membership


