This Model is made available under the CC-0 license.
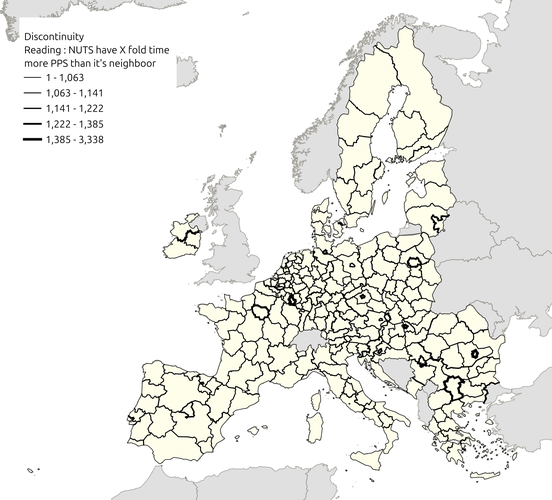
Discontinuity maps highlight the limits (or "boundaries") between the entities studied, by assigning them a thickness relative to the value differential existing between them.
Two methods are used to calculate this differential: * absolute discontinuity: absolute difference between the values of the variable studied, i.e. max(A,B) - min(A,B). * relative discontinuity: relative difference between the values of the variable studied, i.e. max(A,B) / min(A,B).
The visualization of discontinuity lines highlights the spatial breaks in the socio-economic phenomena studied, which, in the words of Brunet and Dolphus (1990), show that "geographical space is fundamentally discontinuous ".
This representation is particularly relevant when combined with a solid color representation like a choropleth map
Was made as part of the continuous improvement to the model designer funded by the Switzerland user group
Thank you!
Reviewed by gabrieldeluca 5 months, 1 week ago

This Model is made available under the CC-0 license.

Flagship membership

Flagship membership

Large membership

Large membership

Large membership

Large membership

Large membership

Large membership

Large membership

Large membership

Large membership

Large membership