This Style is made available under the CC-0 license.
As the creator of this XML warming stripes color scheme, I acknowledge and credit the original inspiration behind the concept:
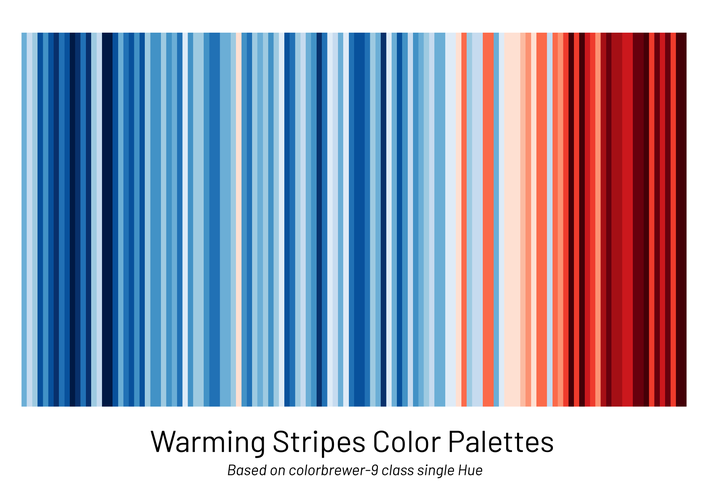
The warming stripes visualization was pioneered by Professor Ed Hawkins from the University of Reading, as a powerful way to communicate climate change through simple, impactful color patterns showing global and regional temperature trends. For the color palette design, I drew from the ColorBrewer tool developed by Cynthia Brewer, which provides scientifically tested color schemes for maps and data visualizations. I adapted the Red-Blue diverging 9-class palette to maintain both accessibility and clarity, ensuring the scheme effectively represents temperature variation. This XML file merges both influences into a practical format for GIS and data visualization.
Thank you very much!
Reviewed by gabrieldeluca 9 months, 4 weeks ago

This Style is made available under the CC-0 license.

Flagship membership

Flagship membership

Large membership

Large membership

Large membership

Large membership

Large membership

Large membership

Large membership

Large membership

Large membership

Large membership